3 Exploratory data analysis
3.1 What is exploratory data analysis?
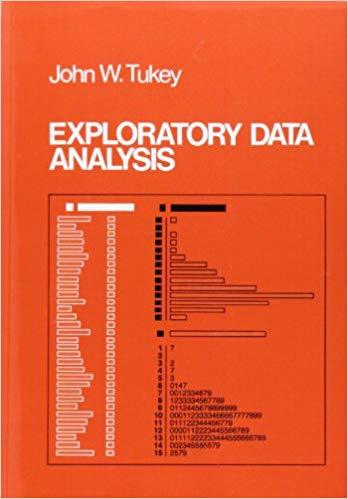
Figure 3.1: The EDA classic.
Exploratory data analysis is detective work – numerical detective work – or counting detective work – or graphical detective work.
To learn about data analysis, it is right that each of us try many things that do not work
Exploratory data analysis (EDA) is an iterative, hypothesis-generating framework. Through EDA, we hope to uncover new relationships among the variables in our data. In EDA, our job is the accumulation of evidence, preferably novel evidence and the widespread availability of powerful computers and able statistical tools means accumulating evidence is much easier now than ever before. But everything we find may not be meaningful. Nonetheless, our job is not to evaluate what we’ve learned but rather discovery and EDA “is an attitude, a state of flexibility, a willingness to look for those things that we believe are not there, as well as those we believe to be there.” It is for researchers building on our sleuthing to evaluate whether what we’ve found is real or not, but it’s not our focus in EDA. Regardless of the ultimate fate of what we’ve found, EDA is vital to science as it challenges our dogmas about the relationships among variables and it forces us to face the fact that our theories may be wrong. It pushes science forwards and provides a framework for designing new studies and experiments to confirm/refute what we’ve found. We’re the detectives, not the judges.
3.2 Confirmatory data analysis
You can only use an observation once to confirm a hypothesis. As soon as you use it more than once you’re back to doing exploratory analysis. This means to do hypothesis confirmation you need to “preregister” (write out in advance) your analysis plan, and not deviate from it even when you have seen the data. Grolemund & Wickham, (2017)
3.3 A framework for EDA
Figure 3.2 shows a framework for data science presented in Grolemund & Wickham (2017). This model is equally applicable for EDA.
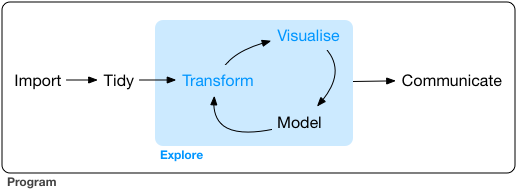
Figure 3.2: Grolemund and Wickham (2017) model of data science.
The first step in any analysis involves importing the data into the software. Depending on how you import data into R, this step can be relatively instantaneous or it can take minutes.
The second step is tidying or reshaping your data. Grolemund & Wickham’s criteria for tidy data are
- Each variable must have its own column.
- Each observation must have its own row.
- Each value must have its own cell.
Note that this does not explicit refer to data being in a wide or long format. Table 11 in Wickham (2014) in the Journal of Statistical Software, shown below in Figure 3.3, highlights this issue. In this particular example, without knowing what X and Y are (e.g., do they code for 1) measurements on two occasions? 2) two items on the same assessment? 3) the height and weight of the participants?) we do not know which format is the tidy one.
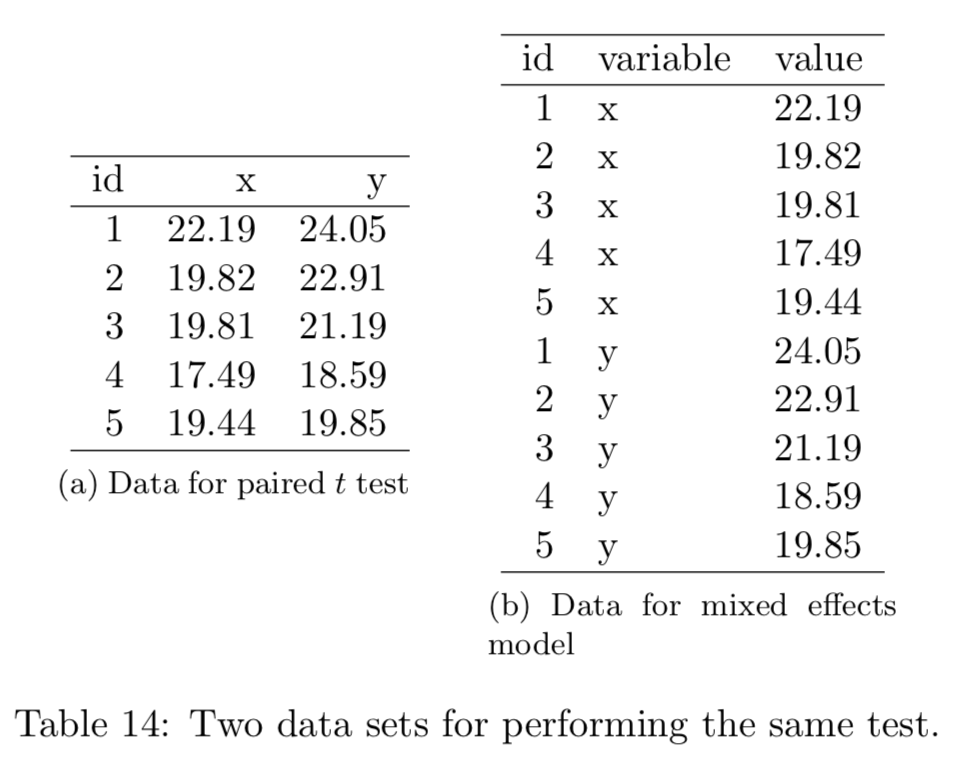
Figure 3.3: Table 11 from Wickham (2014). Which data set is tidy?
The next steps in EDA are iterative and they involve transforming variables (e.g., changing type, rescaling, creating new ones, etc), visualizing these variables (e.g., marginal, bivariate, multivariate plots), and modeling the relationships (can these variables predict/classify our outcomes).
Finally, once an interesting relationship has been discovered it must be communicated and any, arguably all, of these three would be communicated.
3.4 EDA tools