2 Introduction
2.1 What is big data?
When we handle a data-related problem, how do we know that we are actually dealing with “big data?” What is “big data?” What characteristics make a dataset big? The following three characteristics (three Vs of big data, source: TechTarget) can help us define the size of data:
Volume: The number of rows or cases (e.g., students) and the number of columns or variables (e.g., age, gender, student responses, response times)
Variety: Whether there are secondary sources or data that expand the existing data even further
Velocity: Whether real-time data are being used

Figure 2.1: Three Vs of big data
2.2 Why is big data important?
Nowadays nearly every private and public sector of industry, commerce, health, education, and so forth are talking about big data. Data is a strategic and valuable asset when we know which questions we want to answer (see Bernard Marr’s article titled Big Data: Too Many Answers, Not Enough Questions). Therefore, it is very important to identify the right questions at the beginning of data collection. More data with appropriate questions can yield quality answers that we can use for better decision-making. However, too much data without any purpose may obfuscate the truth.
Currently big data is used to better understand customers and their behaviors and preferences. Consider Netflix – one of the world’s leading subscription services for watching movies and TV shows online. They use big data – such as customers’ ratings for each movie and TV show and when customers subscribe/unsubscribe – to make better recommendations for existing customers and to convince more customers to subscribe. Target, a big retailer in the US, implements data mining techniques to predict pregnancies of their shoppers and send them a sale booklet for baby clothes, cribs, and diapers (see this interesting article). Car insurance companies analyze big data from their customers to understand how well their customers actually drive and how much they need to charge each customer to make a profit.
In education, there is no shortage of big data. Student records, teacher observations, assessment results, and other student-related databases make tons of information available to researchers and practitioners. With the advent of new technologies such as facial recognition software and biometric signals, now we get access to a variety of visual and audio data on students. In the context of educational testing and psychometrics, big data can help us to assess students more accurately, while continuously monitoring their progress via learning analytics. We can use log data and response times to understand students’ engagement with the test, whether they were cheating, and whether they had pre-knowledge of the items presented on the test.
2.3 How do we analyze big data?
Big data analysis often begins with reading and then extracting the data. First, we need to read the data into a software program – such as R – and then manage it properly. Second, we need to extract a subset, sample, or summary from the big data. Due to its size, even a subset of the big data might itself be quite large. Third, we need to repeat computation (e.g., fitting a model) for many subgroups of the data (e.g., for each individual or by larger groups that combine individuals based on a particular characteristic). Therefore, we need to use the right tools for our data operations. For example, we may need to store big data in a data warehouse (either a local database or a cloud system) and then pass subsets of data from the warehouse to the local machine where we are analyzing the data.
R, maintained by the R Core Team, has its packages (collect of R functions) available on this The Comprehensive R Archive Network (CRAN). It used to be considered an inadequate programming language for big data (see Douglass Merril’s article from 2012). Fortunately, today’s R, with the help of RStudio and many data scientists, is capable of running most analytic tasks for big data either alone or with the help of other programs and programming languages, such as Spark, Hadoop, SQL, and C++ (see Figure 2.2). R is an amazing data science programming tool, it has a myriad statistical techniques available, and can readily translate the results of our analyses into colourful graphics. There is no doubt that R is one of the most preferred programming tool for statisticians, data scientists, and data analysts who deal with big data on a daily basis.
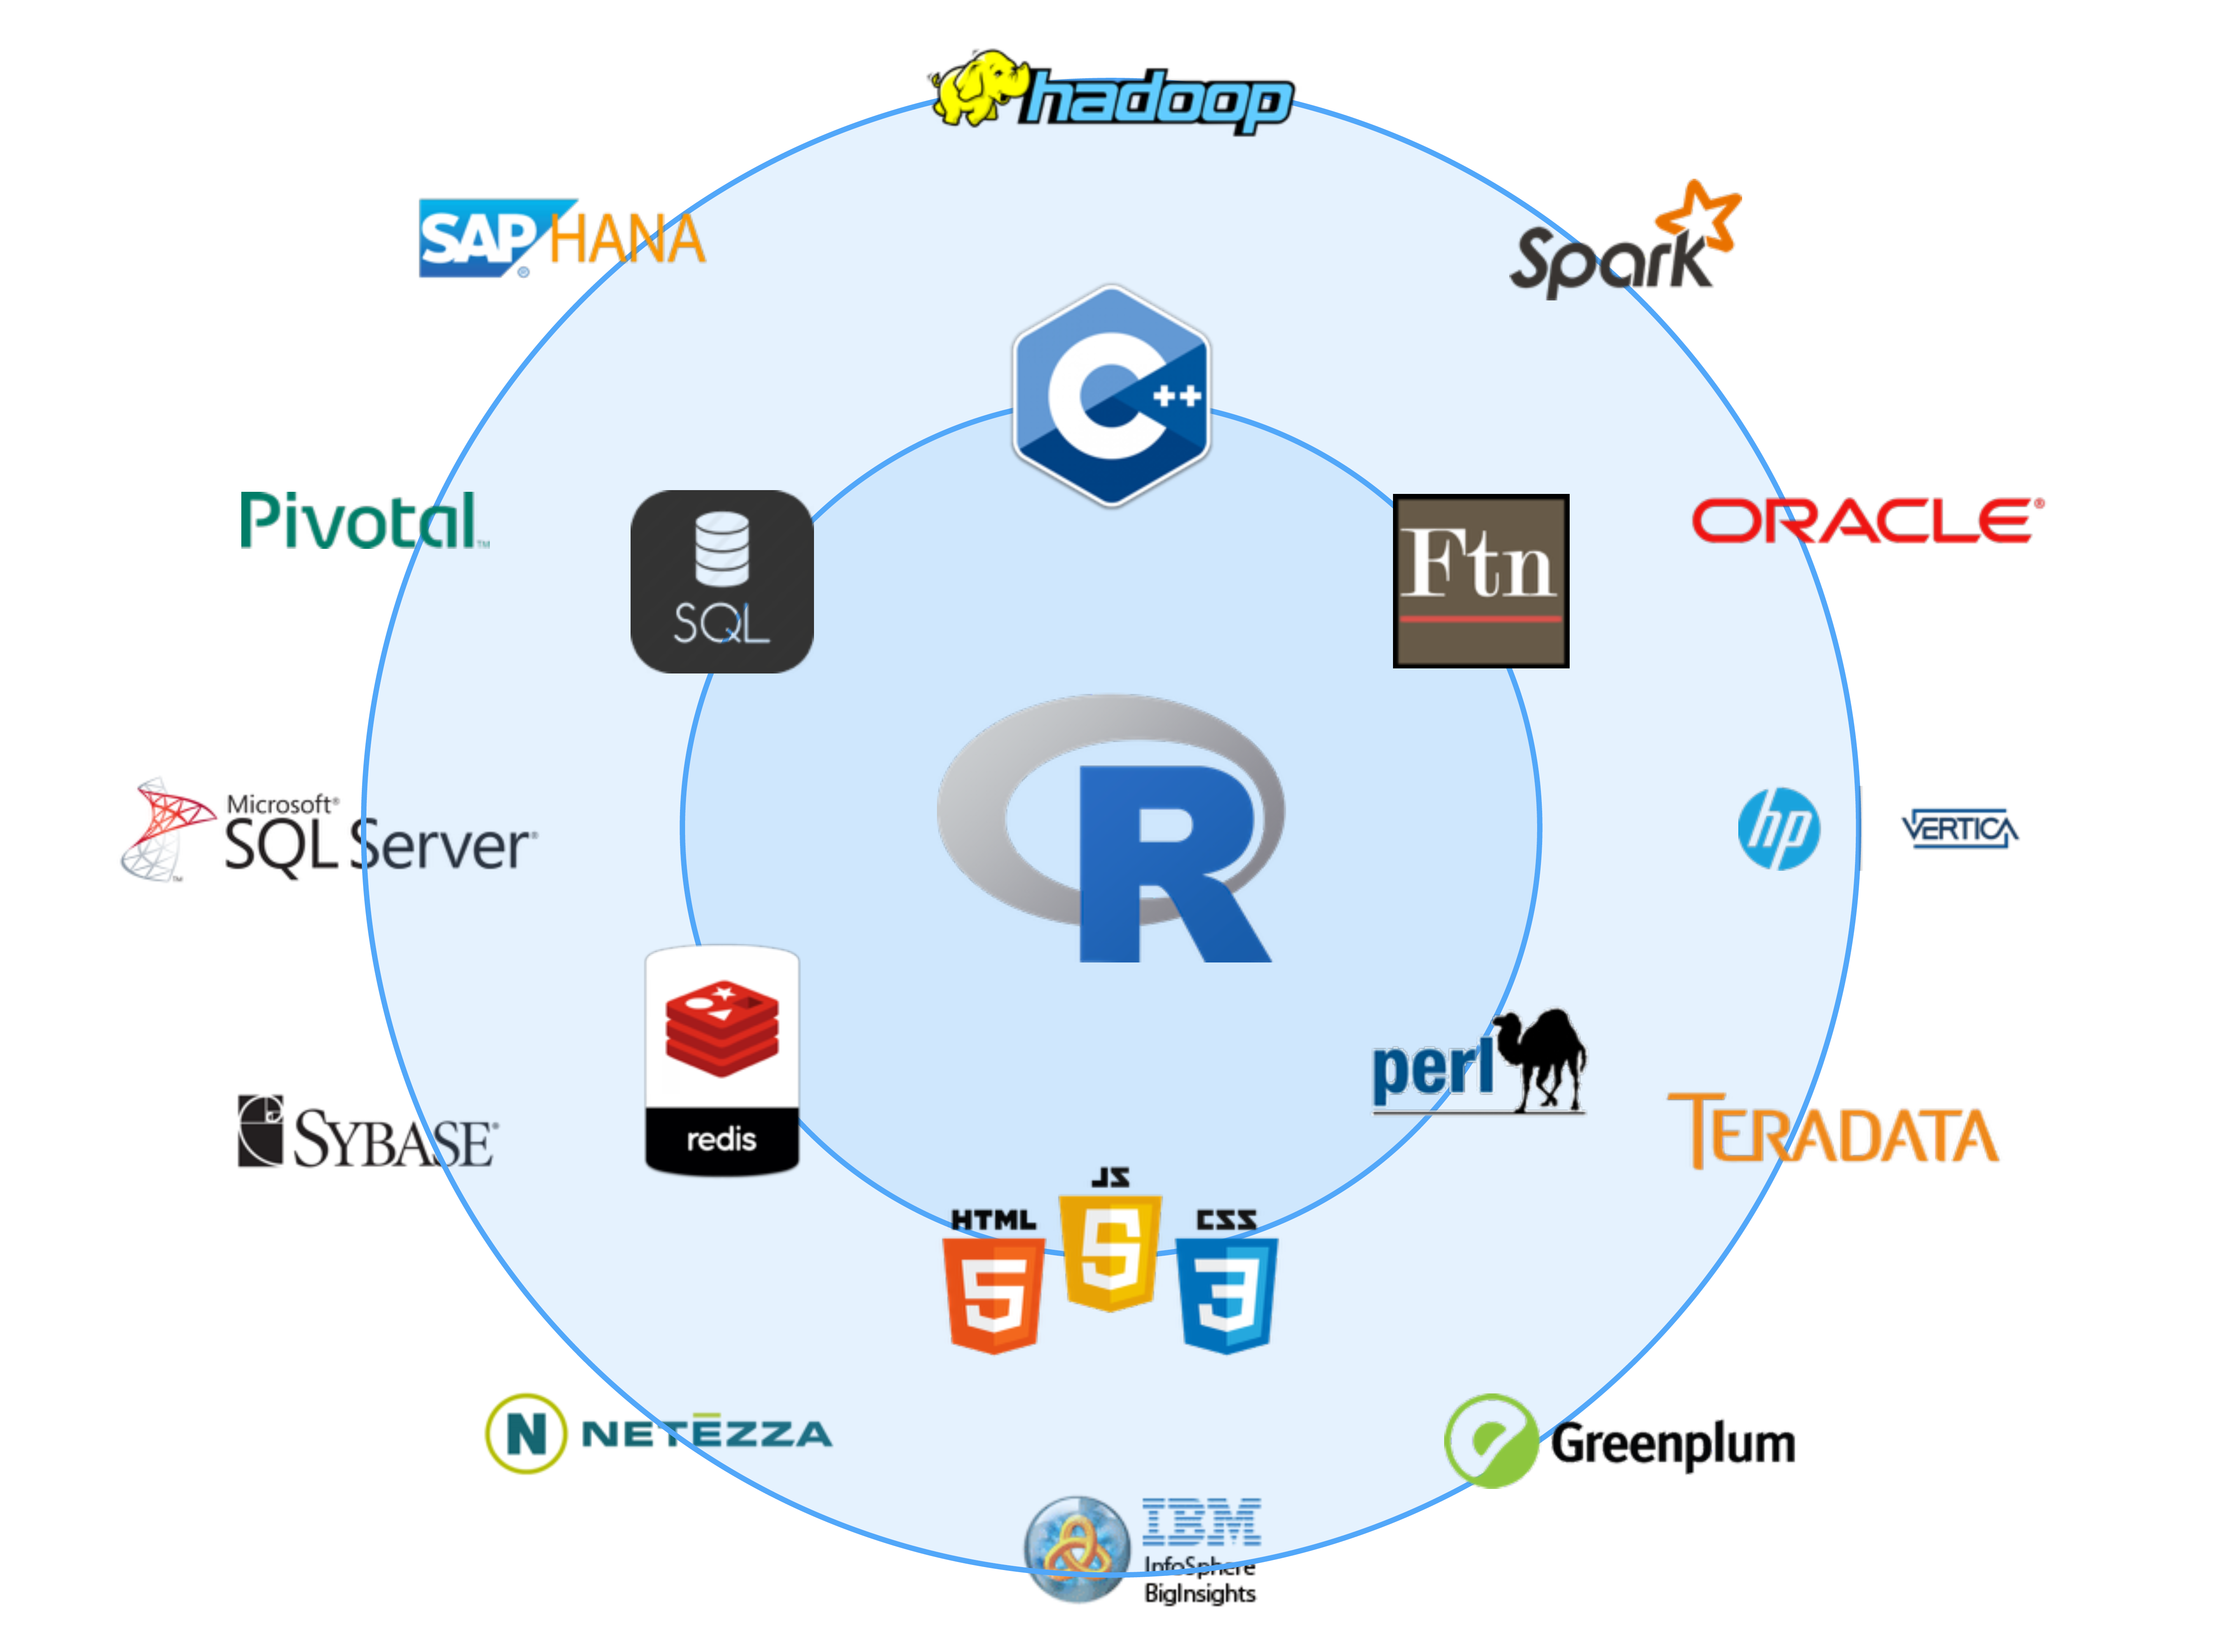
Figure 2.2: Other big data programs integrated with R
Some general suggestions on big data analysis include:
Obtain a strong computer (multiple and faster CPUs, more memory)
If memory is a problem, access the data differently or split up the data
Preview a subset of big data using a program, not the entire raw data.
Visualize either a subset of data or a summary of the big data, not the entire raw data.
Calculate necessary summary statistics manually, not for all variables in big data.
Delay computationally expensive operations (e.g., those that require large memory) until you actually need them.
Consider using parallel computing – parallel and foreach packages and cloud computing
Profile big tasks (in R) to cut down on computational time
start_time <- proc.time()

# Do all of your coding here

end_time <- proc.time()
end_time - start_time

# Alternatively,

system.time({

 # Do all of your coding here

})
During this training session, we will follow these steps and demonstrate how each one helps us explore, visualize, and model big data in R.
2.4 Additional resources
There are dozens of online resources and books on big data analysis. Here are a few of them that we recommend you check out:
James, G., Witten, D., Hastie, T., & Tibshirani, R. (2017). An introduction to statistical learning with applications in R. New York, NY: Springer. (Freely available from the authors’ website: http://www-bcf.usc.edu/~gareth/ISL/index.html)
Grolemund, G., & Wickham, H. (2016). R for data science. Sebastopol, CA: O’Reilly Media, Inc. (Freely available from the authors’ website: http://r4ds.had.co.nz/)
Baumer, B. S., Kaplan, D. T., & Horton, N. J. (2017). Modern data science with R. Boca Raton, FL: CRC Press.
Romero, C., Ventura, S., Pechenizkiy, M., & Baker, de, R. S. J. (Eds.) (2011). Handbook of educational data mining. (Chapman and Hall/CRC data mining and knowledge discovery series). Boca Raton: CRC Press.
RStudio: https://www.rstudio.com/resources/webinars/working-with-big-data-in-r/
2.5 PISA dataset
In this training session, we will use the 2015 administration of the OECD’s Programme for International Student Assessment (PISA). PISA is a large-scale, international assessment that involves students, parents, teachers, and school principals from all over the world as participants. Every three years, PISA tests 15-year-old students from all over the world in reading, mathematics and science. The tests are designed to gauge how well the students master key subjects in order to be prepared for real-life situations in the adult world.
In addition to assessing students’ competencies, PISA also aims to inform educational policies and practices for the participating countries and economies by providing additional information obtained from students, parents, teachers, and school principals through the questionnaires. Students complete a background questionnaire with questions about themselves, their family and home, and their school and learning experiences. School principals complete a questionnaire about the system and learning environment in schools. In some countries, teachers and parents also complete optional questionnaires to provide more information on their perceptions and expectations regarding students. In this training session, we specifically focus on the assessment data and the background questionnaire that all participating students are required to complete.
The 2015 administration of PISA involves approximately 540,000 15-year-old students from 72 participating countries and economies. During this training session, we will sometimes use the entire dataset or take a subset of the PISA dataset to demonstrate the methods used for exploring, visualizing, and modeling big data. For more details about the PISA dataset and its codebooks, please see the PISA website.
The three data files that we will use in this training session can be downloaded using the following links. Please download and unzip the files to follow the examples that we will demonstrate in this training session.
- http://bit.ly/2VleDPZ (all PISA records – 331.65 MB)
- http://bit.ly/2Uf2mQA (only 6 regions with 17 countries – 103.76 MB)
- http://bit.ly/2YNzei0 (randomly selected cases from 6 regions – 22.92 MB)