Statistical Analysis and Visualizations Using R
University of Alberta
1 Overview

Figure 1.1: Source: https://unsplash.com/photos/DErxVSSQNdM
1.1 Course Description
Welcome to Statistical Analysis and Visualizations Using R at the Technology Training Centre. R (R Core Team 2021) is a free and open-source programming language that allows users to access a wide range of statistical and graphical tools. Over the last decade, R has become one of the most widely used statistical software programs among researchers and practitioners around the world due to its growing capabilities through user-created, free packages.
This full-day course is intended to provide participants with a hands-on training in exploring, visualizing, and analyzing data using the R programming language.1 To control R, participants will use RStudio, which is a free, user-friendly program with a console, syntax-highlighting editor that supports direct code execution, and a variety of robust tools for plotting.
1.2 Course Objectives
Upon successfully completing this course, participants will be able to:
- understand the basics of the R programming language
- perform steps to manage different types of data
- execute data preparation steps
- visualize data with various types of variables
- compute descriptive statistics
- compute inferential statistics using R
1.3 Instructor Information
Okan Bulut – University of Alberta
- Associate Professor of educational measurement and psychometrics at the University of Alberta
- 10+ years using R for statistical data analysis and visualization
- Specialized in the analysis and visualization of big data (mostly from large-scale assessments)
- 8+ years teaching courses and workshops on statistics, psychometrics, and programming with R
- Website: https://sites.ualberta.ca/~bulut/
- E-mail: bulut@ualberta.ca
I also co-authored:
- Three R packages:
- A recent book titled Handbook of Educational Measurement and Psychometrics Using R
1.4 Course Structure
This course will introduce participants to statistical and data science procedures widely used in social sciences, public health, and other similar areas. Four aspects of statistical reasoning will be emphasized:
- data wrangling
- data visualization
- univariate statistical methods
- computer applications using R
During the course, we will use the following schedule:
| Part | Description |
|---|---|
| 1 | Introduction (9:00-9:30) |
| Overview of R and RStudio | |
| Basics of R language | |
| 2 | Data Wrangling (9:30-10:30) |
| Creating/importing and managing data | |
| Data manipulation | |
| 3 | Descriptive Statistics (10:30-12:00) |
| Frequency distributions, Graphical tools | |
| Central tendency and dispersion | |
| Break (12:00-13:00) | |
| 4 | Hypothesis Testing (13:00-14:30) |
| Overview of hypothesis testing, t-tests | |
| Analysis of variance (ANOVA) | |
| 5 | Correlation and Regression (14:30-16:00) |
| Correlations for different types of variables | |
| Simple and multiple linear regression |
1.5 Course Materials
Participants will find copies of the course materials in the computers that they will be using. In addition, participants can access these materials online:
- To view the online course notes: https://okanbulut.github.io/rbook/
- To view and download other course materials (e.g., dataset, cheatsheets): https://github.com/okanbulut/rbook
1.6 Learning Process
Learning how to use R is just like learning a new language to speak. So, it might be a bit overwhelming at the beginning. Therefore, I strongly recommend you to ask all of your questions while we go over today’s materials. Collaboration between the training participants is also highly recommended!
1.7 Additional Resources
There are many resources (e.g., websites and books) on statistical data analysis using R on the Internet. A brief list of such resources are shown below:
Websites:
- An Introduction to R: https://cran.r-project.org/doc/manuals/R-intro.pdf
- Using R for Introductory Statistics: https://goo.gl/owJbLg
- Quick R: http://www.statmethods.net/index.html
- R Cookbook: http://www.cookbook-r.com/
Online training:
- Coursera: https://www.coursera.org/learn/r-programming
- DataCamp: https://www.datacamp.com/courses/free-introduction-to-r
- And tons of free videos on YouTube!!!
Books:

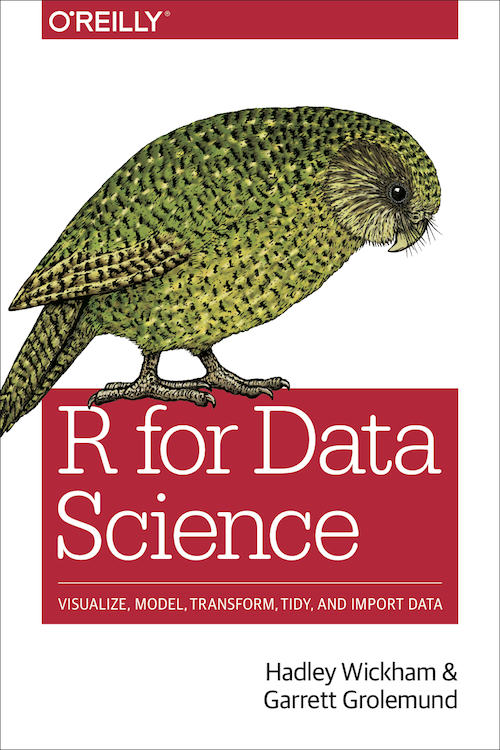
Figure 1.2: https://r4ds.had.co.nz/ (The online version is free!)

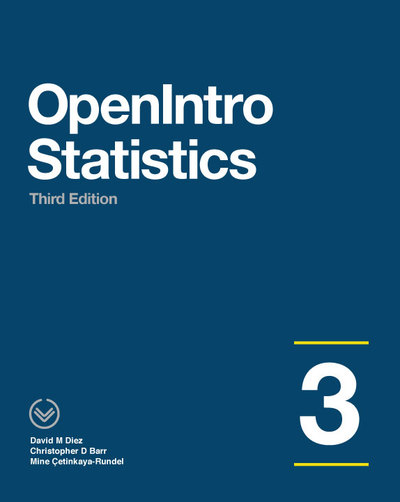
Figure 1.3: https://openintro-ims.netlify.app/ (Free!!!)